Blog


En français

With the help of a Generic Certificate of Secondary Education and Google, you'll find a French version of this site is available from the top right of the screen. To make the change permanent, take a look at the options in 'My Data'.

Cost per Mile/Km

A useful little report has been added for the 2.7 release of the website which combines the MPG over time and cost per litre/gallon reports. Cost per mile/Kilometre gives you a useful reading of how the your driving efficiency and the rising or falling cost of fuel directly affects the true cost of motoring - how much you pay per mile travelled.

Good luck,
whatismympg.co.uk team

Vehicle Range

Just released is version 2.6 of the website - this brings a range report. A new option allows you to set the capacity of your fuel tank, allowing the use of new reports to show how far a tankful of fuel can take you. There's a new chart showing range, as well as a small and quick display of range after you've entered a fill-up

A change to the petrol stations report makes this more accurate allowing better pin-pointing of which brand, if any, give your car the most 'go'.

Spasebo,
whatismympg.co.uk team

Per Vehicle Banners

Two updates in two days!

Today you get a count of fill-ups in some of the reports, allow you to see how statistically important a result is (1 fillup is less important than an average of 50).

Also changed is the ability to use forum banners which are specific to each vehicle you may have rather than an average of all.

Merci,
whatismympg.co.uk team

Partial Fill-Ups

Another update of the site: we now support 'partial fill-ups' - if you don't put a full tank of fuel in when you fill up, you can still record this on the website. These won't count towards MPG or efficiency figures (since it's not possible to measure how much fuel has been used) but you will be able to record the miles and fuel usage of your vehicles for other types of reports we are working on. A quick idea of what's coming is the ability to schedule maintenance based on miles or age.

Also new is a much improved banner/sticker to place on your own website or forum posts, now featuring a coloured background and the make/model of your first configured car.

Finally, we've partnered with getsatisfaction.com to provide you with a channel for support, suggestions and feature requests. On the home page, you'll see a 'Feedback' tag hanging to the right of your browser window. Click this for more information.

Hwyl,
whatismympg.co.uk team

New Charting Tools

We're accelerating development of new features and improvements to the site, starting with completely new charting. The reports are now much more visually appealing and are starting to offer some interactivity - point at your MPG chart and a tag will open showing the exact figure under your pointer.

The new charts also vastly improve the multi-car support. If you use several cars, or track your family or business's fuel economy, the MPG-over-time chart will now provide vehicle vs. vehicle comparisons and display the min/max/average for each vehicle separately. This functionality is also provided in the efficiency report where each type of fuel and separate costing per currency are provided in break-down form.

Finally, we've now got a Twitter account which we'll use to broadcast announcements of new features, hint and tips and the like. Follow us for up to date information!

Gracias,
whatismympg.co.uk team

Personal MPG Banners for your Forum Posts

Welcome to a fresh new update of whatismympg.co.uk! Our best new feature is banner images that you can put on your own website or into forum posts.

Take a look at this example:

The figure shown is the average MPG over the last 30 days, or whatever period you want to configure. If your account is set to record in litres then litres per 100 KM is shown else MPG in Imperial or US units, as per your preferences.

You must opt-in to this feature, so if you don't want your MPG figures to be public, then they won't be.

Have fun showing off how high (or low!) your MPG can be.

Three Year's Deflation

The credit crunch and ensuing economic turmoil are having some nasty effects on a great many people - being forced into pay cuts or job losses for employees, or the employers facing shortfalls in turnover. If you're doing anything but selling food, gas or electricity, you've certainly felt some effect.

The silver lining within all this is that motoring has become cheaper on many levels:

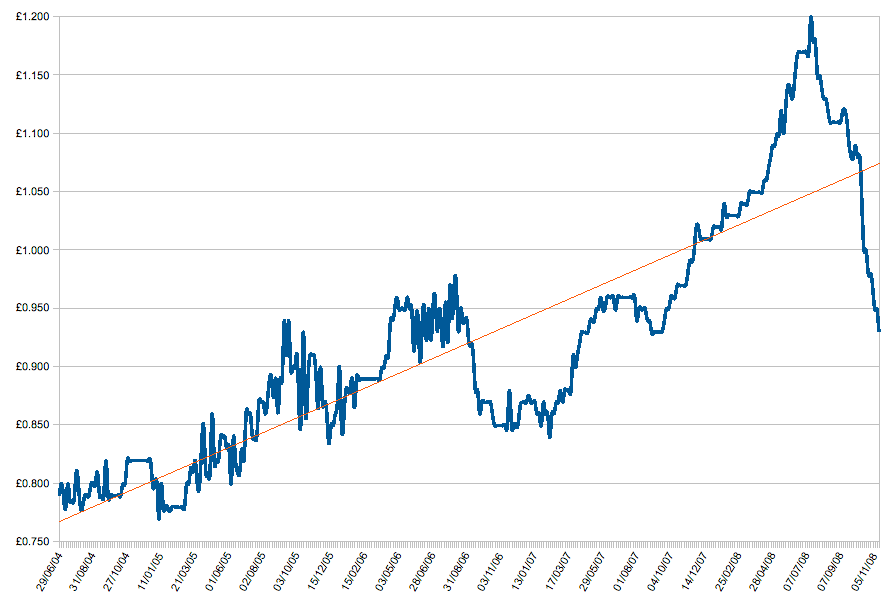
Petrol is now down to around 82.9 pence per litre. That's the level it was at three years ago, though prices have levelled out now - it's worth remembering that with the petrol duty at 55p the cheapest petrol could ever be is 65p. That's if petrol was free and you only paid the duty tax and the oddness that is VAT on the tax.

The caveat on cheap petrol is that you really need to shop around as the differences between individual petrol stations has rarely been wider - barely 100 yards can separate 82.9p from 88.9p. I'm struggling to find good reason for this and have been unable to see a pattern. Previously cheap stations are now expensive and vice versa, with plenty of random variation.

The UK government has partially backed down from the ridiculous increases in road fund. There will still be above inflation increases, but of around £20 instead of £200. Sadly, much damage has already been done here - thousands of pounds has been wiped off the value of larger cars and there's little chance of values increasing...

Conversely, if you're look for a bargain car, now is a good time to look. In the second hand market, small cars and diesels are less affected but something like a 3 litre petrol (never a good bet for residuals) can be had for peanuts. Even high performance cars have seen values cut in half. If you can stretch to new or nearly new, expect to find thousands off the forecourt window prices; that's before you begin to haggle! I've done a little shopping and have seen the highly competent Honda Jazz at two grand off with very little effort.

The world's consumers are holding their breath at the moment, but businesses don't survive without sales; if you're lucky enough to have a job and steady income then there is much out there ready for the taking.

As a footnote, keep using What is my MPG to help you keep your motoring costs down - the site only exists to serve its users. A stack of new features are in the pipeline to help out with that MPG figure as well as some related fuel and money saving projects. Stay tuned!

Winter's Effect

With the cold weather arriving, the first snow and frosted windscreens of the year, there are the obvious warnings to make sure your car is capable of making it through:

  • If your tyres have less than 3mm of tread left, start planning for replacements. You might cope with 2mm during a dry summer (remember those?) but now you'll need that tread pattern to be sweeping the road surface of water and potentially snow.
  • Trouble starting up? Make sure your battery will make it through; the extra stress caused by running heating elements and headlights will quickly take its toll on a weak battery or alternator. If your engine cranks over slowly, get it looked at now rather than at 7am on a dark January morning.

So how does the winter affect your MPG? There are a number of things which can cause a change:
Constant running of lights, especially headlights, the heater motor, the heating elements on back and front screens will cause electrical drain on the battery which must be replaced by the alternator. The alternator will pull more energy from the engine will means more fuel used.
Using aircon to clear windows incurs the same penalty as using aircon to keep cool: as much as 10% extra fuel used.
Colder, more humid air can also cause more fuel to be used.
Increased warmup times. Even if you drive off immediately to use the higher idle (which you should do, if you don't need to clear windows) then the engine management system is still sending more fuel into the engine for several miles yet.

The result of all these is more fuel used. It isn't always very noticeable, particularly if the price of fuel is fluctuating to hide the impact on costs, but for high mileage drivers it can be significant. The graph below shows the MPG of a vehicle monitored for over a year which is used only for long, regular daily trips - there is no variation, no town driving. The orange line is the actual MPG while the blue line is averaged to remove daily fluctuation.

The difference between the minimum fuel efficiency during winter and the maximum of summer is 7%. That's about £91 over 10,000 miles at recent fuel prices.

Four years of petrol prices

I'm sure we are all aware of the falling price of petrol right now, but how does that measure up to what we've been paying before?

The chart below shows the cost for a litre of regular unleaded petrol in UK£ for the last four years.

It is just about possible see that there are regular dips in cost which occur in eleven to twelve months intervals. We are in one of these now. Between these periods the price rockets upwards, the most obvious during the last six months of 2005 and the first seven months of 2008.

Welcome

I'd like to warmly welcome everyone who has registered an account and begun to make good use of the website. Petrol prices have thankfully dropped significantly since launching this site last month but naturally it makes sense to continue to save litres, pennies and the environment by checking that your car is giving you all the efficiency it can.

Today a new update adds a CO2 report. For each tank-full of fuel you use, you can see your actual output of CO2 (you may be surprised by just how much comes out of each litre) and also the grams per Kilometre used by most governments, including the use here in the UK to set the price of the tax disc.

Some interesting figures have already been produced - we've already found that the numbers the government use can be way off what some cars actually produce. A V6 which the government says produces 227 g/km, therefore qualifying for the new £415 super-tax for 226 - 255 g/km, actually produces an average of just 180 g/km over 3 years - incredibly a theoretical saving of £210, if the government used real-life figures.

Check how much you're overpaying for road tax by registering a free account and getting a couple of months CO2 figures calculated.